Alton Lane - Datazeb
Power Bi
- OUR PROJECTS
- Alton Lane
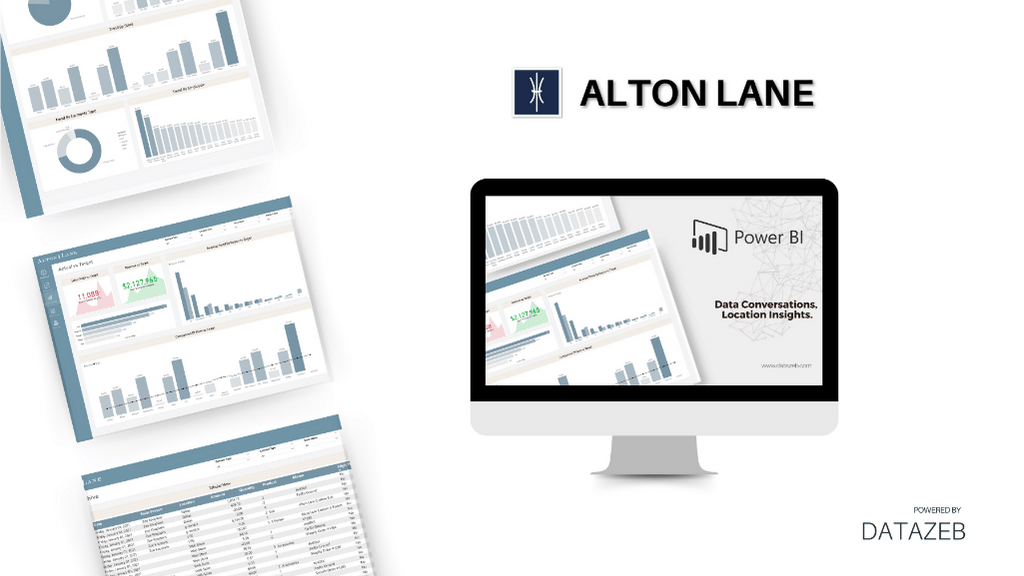
Client: Alton Lane
Duration: 1 Week
Website Link: www.altonlane.com
Category: Power Bi
Project overview :
Alton Lane, an American menswear company, embarked on a strategic initiative to enhance its decision-making processes and performance evaluation through the creation of a comprehensive dashboard. This dashboard is designed to provide key insights and performance metrics related to sales, revenue, and employee performance. The project aimed to offer a consolidated view of the company’s operations, enable data-driven decisions, and optimize business strategies.
What we did for this project :
- Dashboard Creation:
- Developed a user-friendly dashboard to house critical performance metrics and key performance indicators (KPIs).
- Incorporated interactive visual elements to facilitate data interpretation.
- Performance Analysis:
- Total Sales and Revenue: Presented the total sale orders and revenue data using graph charts and tables. Included the calculation of the sum of clothes.
- Revenue Trend by Region:Utilized bar charts to visualize revenue trends by region, enabling a comparison of store performance across countries.
- Performance Trends:
- Trend Analysis: Conducted performance trend analysis across various dimensions, including year, month, store, garments type, and employees. Utilized pie charts and bar charts to represent these trends.
- Actual vs. Target Comparison:
- Sales Order vs. Target: Displayed the comparison between actual sales orders and target sales orders using graph charts.
- Revenue vs. Target: Illustrated the comparison between actual revenue and target revenue using graph charts.
- Revenue Trend by Region: Presented revenue and target data by region in a bar chart table format.
- Archive Management:
Created an archive section to track historical data, including salesperson details, location, amount, quantity, product, and high-priority items. This data is presented in a tabular view, ensuring easy access to historical information. - Employee Performance:
Ranking Metrics: Established performance rankings by region, salesperson, customer, and customer traffic. Utilized bar charts to visualize these rankings, providing valuable insights into employee performance.
Project results :
The creation of the Alton Lane dashboard has led to the following results:
- Enhanced data-driven decision-making with easy access to critical performance metrics.
- Improved monitoring of sales, revenue, and employee performance trends.
- Better alignment with targets through the “Actual vs. Target” analysis.
- Streamlined access to historical data for reference and analysis.
- More effective evaluation of employee performance through rankings and performance metrics.
Our Services
Contact Now
Copyright ©2025 Datazeb.com | All rights reserved

