Verge Mobile - Datazeb
Power Bi
- OUR PROJECTS
- Verge Mobile
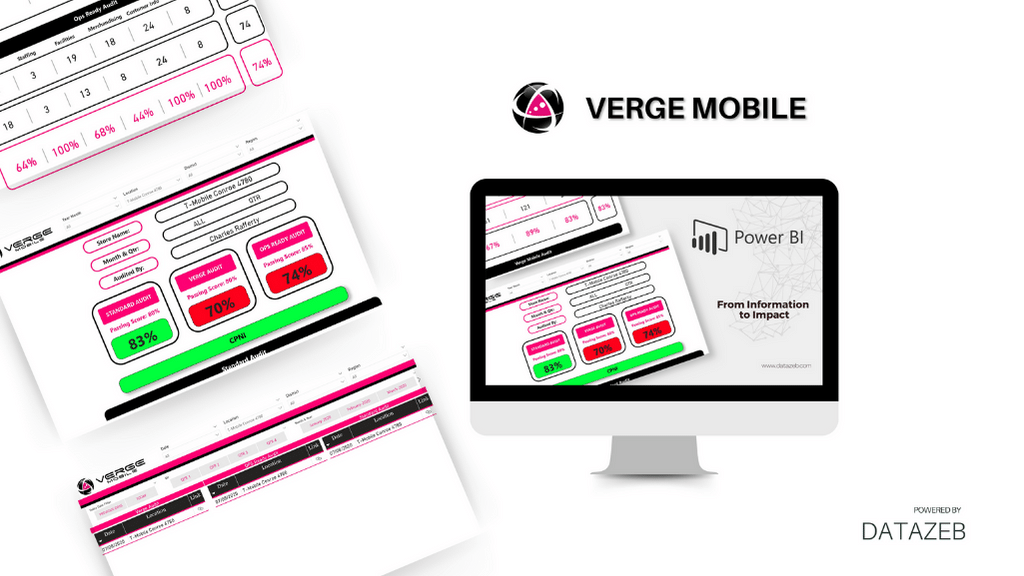
Client: Verge Mobile
Duration: 2 Years
Website Link: www.vergemobile.com
Category: Power Bi
Project overview :
Verge Mobile, a retail company with over 50 locations across 10 states, faced a challenge: they lacked visibility into key performance metrics for their retail locations. Store managers relied on basic Excel reports for sales data, leading to a decentralized and inefficient tracking system. To address this issue, Verge Mobile initiated a project with the following goals:
- Build an automated analytics platform with interactive dashboards for real-time visibility into retail operations.
- Enable daily tracking of 100+ Key Performance Indicators (KPIs) for each store, covering sales, conversion rates, foot traffic, average ticket size, and Net Promoter Scores.
- Monitor service metrics such as First Call Resolution, Wait Times, and Support Ticket Aging to enhance the customer experience.
- Rank stores by overall performance and individual metrics to identify high and low performers.
- Drill down into trends by product, segment, geography, and store manager to uncover insights.
- Establish dynamic targets tailored for each store based on trends, seasonality, and peer benchmarks.
- Provide actionable insights to optimize staffing, merchandising, promotions, and pricing for sales growth.
- Aim to reduce support call waiting times by 20% and increase first call resolution by 30%.
- Strive for a 15%+ increase in sales conversion rates across the retail chain in the first year.
What we did for this project :
To achieve these objectives, we adopted the following technical approach:
- Implemented Extract, Transform, Load (ETL) processes to extract daily data from source systems and load it into a cloud data warehouse.
- Designed a star schema Online Analytical Processing (OLAP) model optimized for slicing and dicing operations data.
- Built aggregated metrics, KPIs, and advanced analytics using Data Analysis Expressions (DAX) calculations.
- Created interactive Power BI dashboards with drill-down capabilities, synchronized filtering, and conditional formatting.
- Embedded dashboards into an internal portal with row-level security and access controls.
- Automated the delivery of reports to store managers daily via email.
- Leveraged artificial intelligence (AI) and machine learning (ML) for forecasting, anomaly detection, and predictive insights.
- Data Warehouse Build: 4 weeks
- ETL & Data Modeling: 3 weeks
- Dashboard Design: 4 weeks
- User Acceptance Testing: 2 weeks
- Training & Change Management: 1 week
Project results :
The project yielded significant outcomes, including:
- Establishment of a centralized, real-time analytics platform providing visibility into daily store operations.
- Monitoring and tracking of over 100 KPIs, improving performance evaluation and decision-making.
- Enhanced customer service metrics through the optimization
Our Services
Contact Now
Copyright ©2025 Datazeb.com | All rights reserved

