
Case study · Logistics
Marketplace performance analytics for a digital freight platform
A digital freight platform connects shippers with freight forwarders across sea, air, road and warehousing. Datazeb built the analytics that show how the marketplace, and each forwarder on it, is performing.
- Client
- Digital freight platform (anonymised)
- Region
- UK and Middle East; South Asia network
- Scale
- Forwarders in 20+ countries
- Work
- Power BI marketplace analytics
The challenge
What was difficult
The platform handles multimodal shipments by sea, air, road and warehouse, through a growing network of freight forwarders in many countries.
Management needed to see whether the marketplace was working: which forwarders were active, how quickly they answered rate requests, how many requests became bookings, and where demand came from. Without that, it was hard to manage forwarder quality or improve operational efficiency.
Data involved
- Platform registrations and sign-ups by country
- Forwarder logins and activity
- Rate requests and responses
- Bookings by status, service mode and value
- Forwarder profiles and services offered
Architecture
How the solution fits together
Sources
- Platform registrations and sign-ups by country
- Forwarder logins and activity
- Rate requests and responses
- Bookings by status, service mode and value
- Forwarder profiles and services offered
Data model
- Marketplace model
- SQL
- DAX
- Power Query
Reporting
- Forwarder performance scoring
Who uses it
- Power BI dashboards
Decisions
- Network & quality decisions
What we built
The delivered solution
Two connected views: one for platform management, and a performance dashboard for each forwarder that uses the same measures.
-
Marketplace overview
Registered and pending forwarders by country on a map, sign-ups over time, and active against idle accounts.
-
Forwarder performance scoring
Each forwarder is scored on rates available, bookings, response rate, response time and request-to-booking conversion, against a target band, with top performers ranked.
-
Bookings and rate requests
Volumes by origin country and service mode (sea, air, truck and warehouse), booking status from review to completion, and booking value by currency.
-
Engagement tracking
Login history and activity trends, so inactive forwarders can be followed up before they drop out of the network.
From the project
Screens from the delivered reports
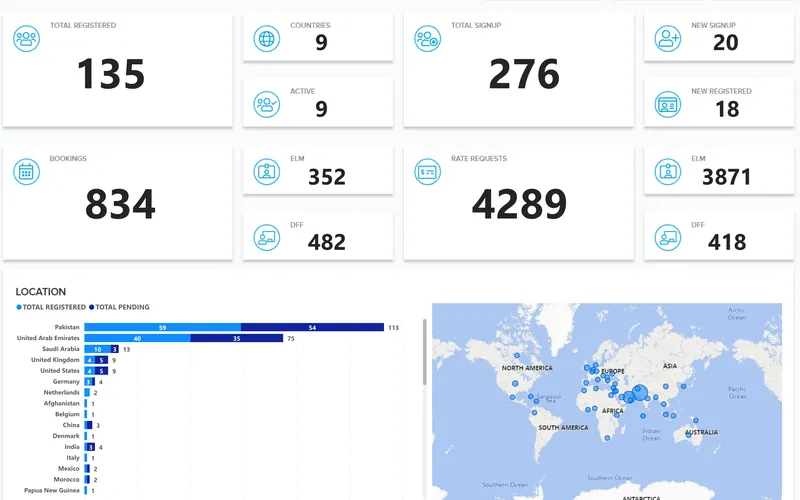
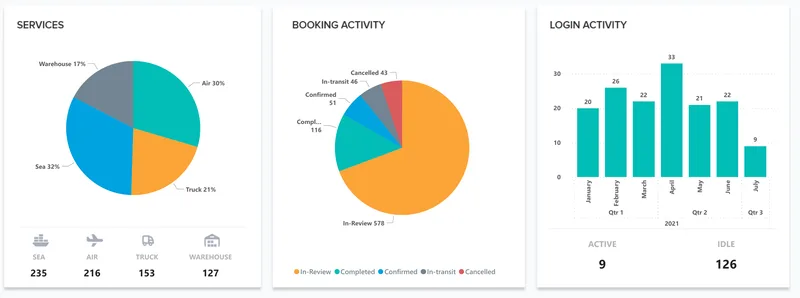
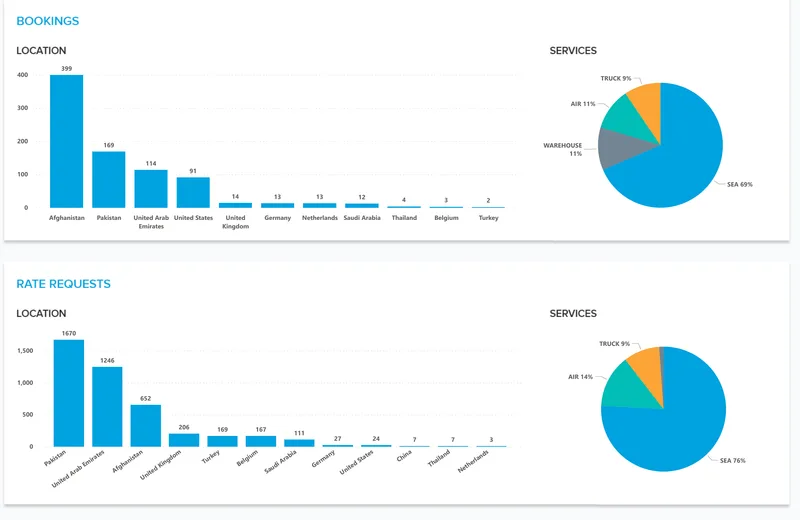
Clients are anonymised. Screenshots come from the delivered reports, with client names, logos, people and locations removed. Figures shown are the reports' own data, not results claimed by Datazeb.
Outcome
What changed
- Forwarder quality is measured the same way for everyone, rather than judged case by case.
- Slow responses and low conversion show up per forwarder, so they can be dealt with.
- Demand by country and service mode is visible for network and sales planning.
- Inactive forwarders are identified from login and booking activity.
Specific commercial metrics are withheld for confidentiality.
Technology
Tools and related work
- Power BI
- SQL
- DAX
- Power Query
- Map visuals
Related
Facing a similar problem?
Tell us what is difficult today. We can help determine whether a similar approach could work in your environment.