
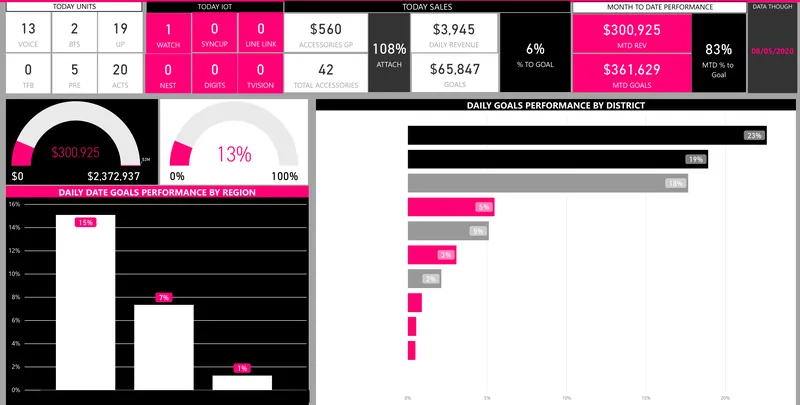
The retail data problem
The numbers often exist – just not in one reliable place
Retail performance is usually spread across systems designed for different purposes.
- POS platforms
- Inventory and warehouse systems
- ERP / accounting software
- E-commerce platforms
- Supplier files and portals
- CRM / loyalty systems
- Manual spreadsheets
- Marketplace or third-party sales channels
When sales, stock, product, supplier, and financial data are not aligned, teams spend time reconciling reports instead of deciding what to buy, move, promote, or stop carrying.
Typical retail and inventory challenges
- POS sales do not reconcile cleanly with finance or inventory
- Stock levels differ between systems
- Product codes and descriptions are inconsistent across sources
- Store managers receive different versions of performance reports
- Replenishment depends on spreadsheets or manual judgement
- Slow-moving and dead stock is identified too late
- Supplier performance is difficult to measure consistently
- Margins are unclear by product, category, channel, or location
- Online and physical-store reporting is separated
- Daily or weekly reporting requires repetitive manual preparation
What Datazeb can deliver
Sales Performance Analytics
Track revenue, units, transactions, products, categories, stores, channels, trends, and targets.
Inventory Intelligence
Monitor stock on hand, availability, ageing, movement, slow-moving items, and stock exceptions.
Replenishment Analytics
Combine sales velocity, stock levels, lead times, and business rules to support more informed reorder decisions.
Margin & Profitability Reporting
Analyse gross margin and commercial performance by product, category, location, customer, or channel where source data allows.
Store & Location Performance
Compare locations using consistent KPIs while preserving the ability to drill into local detail.
Supplier & Vendor Analytics
Track purchasing, delivery, product, lead-time, and supplier-related performance indicators.
Retail Data Integration
Connect POS, ecommerce, inventory, finance, ERP, files, APIs, and databases into a structured reporting layer.
Automated Reporting & Alerts
Reduce manual reporting and notify users when stock, sales, or operational conditions need attention.
From retail systems to one trusted view
- POS / Commerce
- Inventory / ERP
- Transform & Reconcile
- Trusted Retail Model
- Power BI / Alerts
The important work often happens between the source systems and the dashboard: product mapping, store mapping, date logic, transaction rules, stock movements, unit conversions, and reconciliation.
Sales performance analytics
See performance by the dimensions that matter
- Revenue and unit sales
- Average transaction value
- Transactions and basket indicators
- Product / SKU performance
- Category and brand performance
- Store / location performance
- Channel performance
- Daily, weekly, monthly, and seasonal trends
- Target vs actual
- Promotion analysis where the required data is available
Outcome: a consistent commercial view that helps management move beyond manually assembled sales reports.
Inventory intelligence
Stock visibility should explain more than what is currently on hand
Useful inventory reporting combines current availability with movement and demand context.
- Stock on hand
- Available vs committed stock where available
- Days of stock / cover
- Sales velocity
- Stock ageing
- Slow-moving products
- Dead stock
- Stockouts
- Overstock indicators
- Warehouse / store comparison
- Inventory movement history
Outcome: faster identification of inventory problems before they become larger commercial issues.
Replenishment and reorder analytics
Support buying decisions with better context
Datazeb can help create replenishment indicators based on the data and business rules available in the client’s environment.
- Recent sales velocity
- Current stock
- Expected demand
- Supplier lead time
- Minimum / maximum stock rules
- Safety-stock logic
- Open purchase orders where available
- Seasonality and promotional context
Product and SKU master-data challenges
Retail analytics breaks quickly when products are not mapped consistently
The same product may appear with different SKUs, descriptions, barcodes, pack sizes, supplier codes, or channel-specific identifiers.
Datazeb can help establish mapping and reference logic around:
- SKU and product identifiers
- Barcodes
- Product categories
- Brands
- Supplier codes
- Pack / unit conversions
- Store-specific references
- Ecommerce vs POS product identifiers
This work is often essential before sales and inventory reports can be trusted.
Store and location performance
Compare performance consistently across locations
- Sales and margin
- Transaction activity
- Product mix
- Inventory availability
- Stockouts
- Slow-moving stock
- Performance vs target
- Period-on-period trends
- Store ranking by selected KPI
Role-based views can give central management a consolidated picture while allowing store or regional users to see only the information relevant to them.
Supplier and purchasing analytics
Connect buying decisions to supplier and product performance
- Purchase value and volume
- Supplier concentration
- Lead-time trends
- Order / receipt comparison
- Product availability
- Supplier-linked stockouts
- Price changes
- Supplier / category performance
The exact metrics depend on the purchasing and receiving data available in the client’s systems.
Margin and profitability
Revenue alone does not show whether the mix is healthy
Where cost and pricing data is available, Datazeb can help analyse:
- Gross margin by product
- Margin by category
- Margin by store / location
- Margin by channel
- High-revenue / low-margin products
- Discount and promotion effects
- Customer or segment profitability where appropriate
Definitions should be agreed with finance before margin measures are published as management KPIs.
Omnichannel and ecommerce visibility
Bring online and physical-channel performance into a common model
For businesses selling through multiple channels, Datazeb can help align reporting across:
- Physical stores
- Ecommerce platforms
- Marketplaces
- Wholesale / B2B channels
- Click-and-collect or fulfilment workflows
- Shared inventory pools where available
The objective is to avoid separate reporting realities for different channels.
Alerts and exception reporting
Do not make managers search every dashboard for the problem
Datazeb can build alerts or exception views around defined operational rules.
- Low-stock / out-of-stock exceptions
- Unusual sales movement
- Slow-moving stock
- Data refresh failures
- Missing product mappings
- Inventory reconciliation differences
- Store performance exceptions
- Supplier or purchasing exceptions
AI opportunities in retail
Apply AI where it helps interpret information or support a workflow
- Internal product / policy knowledge assistants
- Customer support chatbots using approved information
- Natural-language questions over curated sales data
- Document or supplier-file classification
- AI-assisted exception summaries
- Product information enrichment with human review
AI should sit on top of a trusted data and process foundation, not compensate for poor product or inventory data.
Data quality and reconciliation
Retail reporting needs repeatable checks
- Missing SKUs
- Duplicate products
- Negative or unexpected stock
- Sales with no matching product
- Store / location mismatches
- Missing cost data
- Late source feeds
- Transaction totals that do not reconcile
- Inventory movement gaps
Automated validation can surface these issues before they reach executive reporting.
Why Datazeb for retail analytics
- Strong BI and data-engineering capability in one team
- Experience working across APIs, POS-style data, inventory, databases, and Power BI
- Focus on product and source reconciliation before dashboard design
- Ability to combine reporting, integration, alerts, automation, and ongoing support
- Practical commercial focus on sales, stock, margin, and operational visibility
- Flexible project and retainer models
- Global remote delivery
Engagement options
- Retail reporting assessment
- Sales / inventory dashboard project
- POS and inventory data integration
- Product master-data cleanup and mapping
- Multi-store reporting implementation
- Replenishment / exception analytics project
- Automated reporting and alerting
- Managed analytics support
How we work
- Understand
Clarify how sales, inventory, products, stores, suppliers, and finance are managed today. - Map
Document the source systems, keys, product hierarchies, locations, transaction logic, and reporting definitions. - Reconcile
Resolve the mapping and business-rule differences that create inconsistent numbers. - Build
Develop integrations, trusted models, Power BI reporting, alerts, and automation. - Validate & Support
Confirm results with business users, document the logic, and improve the solution as operations evolve.
FAQ
Can you connect our POS and inventory systems?
Often, yes. The method depends on the APIs, databases, files, or connectors available in each platform.
Can you report across multiple stores?
Yes. Datazeb can build consolidated reporting with location-level drill-down and role-based access where required.
Can you help with product-code mismatches?
Yes. Product, barcode, category, supplier, and channel mapping is a common part of creating a reliable retail reporting model.
Can you build reorder or replenishment dashboards?
Yes, where the required sales, inventory, supplier, lead-time, and business-rule data is available.
Can you combine ecommerce and physical-store data?
Yes. Datazeb can align multiple channels into a common model where the required data and identifiers can be reconciled.
Do you provide ongoing support?
Yes. Managed analytics support can cover new dashboards, source changes, troubleshooting, integrations, and ongoing enhancements.
