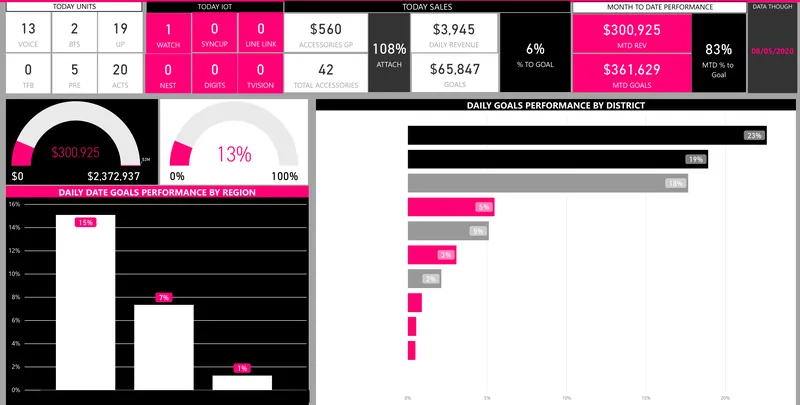
Client names are withheld. Specific commercial metrics are not published for confidentiality.
From sales systems to one commercial view
The key challenge is often not extracting data. It is aligning customer IDs, account owners, product hierarchies, sales stages, dates, targets, revenue definitions, and finance outcomes across systems.
01CRM / Pipeline
02ERP / Orders
03Finance / Revenue
04Trusted Sales Model
05Power BI / Action
In detail
Explore the detail
Sales performance analytics
Revenue vs target
Units or volume
Growth vs prior period
Average deal / order value
Customer count
New vs existing business
Region / territory performance
Salesperson / account-owner performance
Channel performance
Product or service mix
Pipeline and funnel analytics
See what is likely to convert – and where deals are getting stuck
Where CRM discipline is weak, analytics should expose missing stages, stale opportunities, or incomplete ownership rather than pretending the pipeline is precise.
Pipeline value
Opportunities by stage
Stage conversion
Opportunity ageing
Sales-cycle length
Pipeline velocity
Win / loss analysis
Expected close timing
Coverage against target
Customer and account analytics
Customer analytics should help account teams see both current performance and changes that may require attention.
Revenue by customer
Growth / decline by account
Top customer concentration
New vs returning customers
Account-owner performance
Cross-sell / service mix
Inactive or declining accounts
Geographic or segment trends
Product and service analytics
Product reporting is strongest when sales, inventory, finance, and product master data are aligned.
Revenue by product / service
Units or quantity
Sales velocity
Category / brand mix
Margin where cost data is available
Product growth / decline
Channel performance
High-revenue / low-margin items
Territory, branch and team performance
Shared KPI definitions make comparisons meaningful and reduce arguments about which report is correct.
Region / territory comparison
Sales team performance
Account-owner performance
Branch / location reporting
Target attainment
Pipeline coverage
Customer growth
Product mix
Targets, forecasting and planning
Bring target, pipeline, forecast and actuals into one management view
Target vs actual
Forecast vs actual
Forecast by salesperson / region
Pipeline coverage
Committed / best-case / pipeline scenarios where used
Expected close timing
Historical forecast accuracy where data is available
Sales and finance alignment
Revenue should reconcile beyond the CRM
Datazeb can connect commercial reporting with finance so leadership can distinguish pipeline, booked orders, invoiced revenue, recognised revenue, refunds, cancellations, or other relevant states. The exact commercial definitions should be agreed between sales and finance.
CRM opportunity vs order
Order vs invoice
Revenue by customer / product
Margin where finance data supports it
Sales adjustments
Period reconciliation
Data quality and CRM governance
Better dashboards cannot compensate for poor sales-process data. Datazeb can surface these issues and help make the reporting rules explicit.
Duplicate customer records
Missing opportunity owners
Stale opportunities
Inconsistent pipeline stages
Unmapped products
Missing close dates
CRM / finance revenue mismatches
Inconsistent territory mappings
FAQ
Frequently asked questions
Can you connect our CRM to Power BI?
Yes. The method depends on the CRM's APIs, database access, connectors, or export capabilities.
Can you combine CRM pipeline with actual revenue?
Yes. Datazeb can align opportunity, order, invoice, and finance data where reliable identifiers and business rules are available.
Can you build sales forecasting dashboards?
Yes. We can report targets, pipeline, forecasts, and actuals. More advanced predictive forecasting should only be used where the data and sales process support it.
Can you compare territories or sales teams?
Yes. Datazeb can create consistent territory, branch, team, and salesperson reporting using shared KPI definitions.
Can you build customer and product analytics?
Yes. Customer, product, channel, and commercial performance can be combined where the required source data is available.
Learn it yourself · Datazeb Training
Learn Power BI with Datazeb Training
Prefer to build the skills in-house? Live online Power BI courses taught by the same practitioners who deliver these projects.
Connect pipeline, revenue, customers and products into one commercial picture
If your sales teams, finance reports, and CRM dashboards tell different stories, tell us how reporting works today. Datazeb can help create a more reliable view of sales performance – from opportunity and target through to actual revenue and customer outcomes.