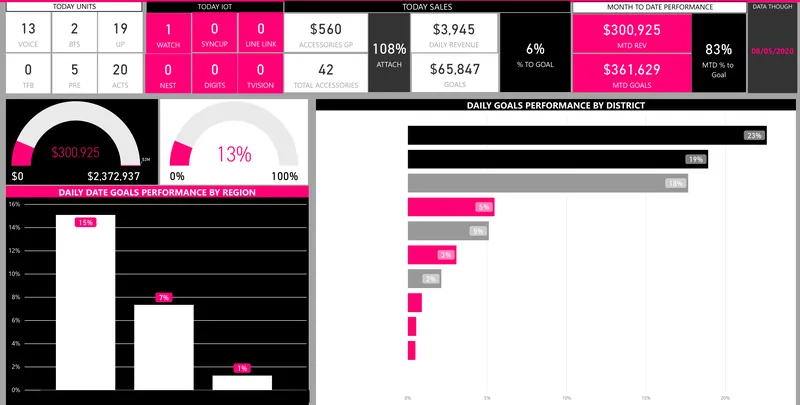
The executive reporting problem
Leadership often sees the final spreadsheet – not the effort required to create it
- Finance, sales, operations, and service teams report from different systems
- Monthly reporting depends on exports and copy-paste
- Departments use different KPI definitions
- Management receives the numbers after the period has already moved on
- One report must be rebuilt every month
- Leadership sees totals but cannot easily investigate what caused the change
- Data issues are discovered during the reporting meeting
- Only one or two people understand how the management pack is assembled
The visible reporting problem is often a symptom of a deeper data, integration, or governance problem.
What Datazeb can deliver
Executive KPI Dashboards
A focused management view across the measures leadership needs to monitor regularly.
Board & Management Reporting
Structured recurring reporting that replaces spreadsheet-heavy packs with a more repeatable process.
Cross-Department Reporting
Bring finance, sales, operations, service, inventory, workforce, or customer measures into one model.
KPI Definition Framework
Clarify metric ownership, source systems, calculation logic, refresh frequency, and approved business definitions.
Automated Reporting
Schedule data ingestion, transformation, refresh, distribution, alerts, and recurring management summaries.
Drill-Down & Root-Cause Views
Move from headline metrics into the customers, products, locations, teams, or transactions behind the result.
Role-Based Management Views
Give executives, department heads, and local managers the right level of detail without duplicating reporting logic.
Ongoing Reporting Support
Keep dashboards, sources, KPIs, integrations, and recurring reporting processes current as the business changes.
From fragmented reporting to one management view
- Business Systems
- Integration
- KPI Logic
- Executive Reporting
- Action
A trusted executive dashboard is usually the final layer. Underneath it, the organisation needs reliable source connections, common business definitions, validation, refresh logic, security, and clear ownership.
Start with management questions
The dashboard should answer decisions, not display every available metric
Before designing visuals, Datazeb should identify the questions leadership repeatedly needs answered.
- Are we on plan?
- Where did performance improve or decline?
- Which business unit, location, customer, product, or service is driving the result?
- What requires attention now?
- What changed compared with last period?
- Which metrics are leading indicators and which are lagging?
- Where are the numbers unreliable or incomplete?
KPI framework and governance
A dashboard cannot resolve disagreement about what the number means
Datazeb can help create a practical KPI framework covering:
- Metric name and business purpose
- Definition and calculation
- Authoritative source
- Metric owner
- Refresh frequency
- Required grain and dimensions
- Approved exclusions or adjustments
- Historical restatement rules where relevant
Executive dashboard design
Show enough to manage the business – not everything the data model can produce
A strong executive view normally combines:
- A small number of headline KPIs
- Current period vs target / prior period
- Trend context
- Exceptions or alerts
- Key segment breakdowns
- Ability to drill into detail
- Clear notes where definitions or source limitations matter
The design should support a management conversation, not compete for attention with unnecessary charts.
Finance visibility
Connect commercial performance with the financial outcome
Where finance data is available, executive reporting may include:
- Revenue
- Gross margin
- Budget vs actual
- Operating cost categories
- Cash or working-capital indicators where appropriate
- Entity / department / location comparison
- Period trends
Finance definitions should be validated with the organisation’s finance stakeholders before publication.
Sales and customer visibility
- Sales vs target
- Pipeline and conversion
- Customer / account performance
- Product or service mix
- Channel performance
- New vs existing customers
- Geographic performance
The exact measures depend on the commercial model and the quality of CRM, sales, and finance data.
Operations visibility
- Throughput
- Backlog
- Service levels
- Utilisation
- Capacity
- Operational exceptions
- Location / team comparison
- Daily / weekly trend indicators
Operational measures should help management identify where performance is changing before the issue appears in monthly financial results.
Inventory and supply visibility
For product- or inventory-led businesses, the executive view may also include:
- Stock availability
- Stockouts
- Days of stock
- Slow-moving inventory
- Supplier exceptions
- Replenishment indicators
- Warehouse / location comparison
Multi-entity and multi-site reporting
One executive view across the group, with controlled local detail
Datazeb can standardise reporting across:
- Companies
- Business units
- Branches
- Stores
- Clinics
- Regions
- Departments
- Franchise or operating entities
Leadership can see consolidated performance while authorised local users retain the detail needed to manage their own area.
Reporting automation
The reporting process should not restart from zero every month
- Scheduled source refresh
- Automated transformation
- Validation before publication
- Power BI refresh
- Management notifications
- Recurring distribution
- Threshold / exception alerts
- Automated commentary support where appropriate
Automation reduces repetitive preparation, but controls should remain around material adjustments, commentary, and high-impact decisions.
Data quality and reconciliation
Management reporting should expose uncertainty instead of hiding it
Datazeb can build validation around:
- Missing source feeds
- Duplicate transactions
- Unmapped entities or products
- Totals that do not reconcile
- Unexpected period changes
- Missing KPI inputs
- Late refreshes
- Changed source definitions
Where a number is provisional or incomplete, the reporting process should make that visible rather than presenting false certainty.
Role-based reporting
Executives, department heads, and operational managers do not need the same view
A shared data model can support different reporting experiences without creating separate sources of truth.
- Executive summary
- Finance view
- Sales view
- Operations view
- Regional / local view
- Department-specific detail
Access controls such as Power BI row-level security can be used where appropriate.
Management commentary and AI
Use AI to support interpretation – not to invent the explanation
AI can help draft summaries or surface patterns from approved data, but management commentary still needs business context and human judgement.
Potential use cases include:
- Draft period summaries from approved KPIs
- Highlight unusual movements
- Generate first-pass commentary for review
- Allow natural-language questions over curated management data
- Summarise operational exceptions
Existing reporting review
You do not need to rebuild everything to improve executive visibility
Datazeb can begin by reviewing:
- Current management pack
- Existing Power BI reports
- Excel workbooks
- Source systems
- Recurring manual steps
- KPI definitions
- Known reconciliation issues
- User access and distribution
The outcome may be a targeted improvement, a phased rebuild, or a broader reporting roadmap depending on the environment.
Why Datazeb for executive reporting
- Business-first approach – start with management questions and decisions
- Power BI + data engineering capability in one team
- KPI definition and governance before visualisation
- Ability to integrate finance, sales, operations, inventory, and other systems
- Automation and managed support after launch
- Senior-led delivery
- Global remote collaboration
Engagement options
- Executive reporting assessment
- Management dashboard project
- Board reporting modernisation
- KPI framework and governance
- Cross-department data integration
- Multi-entity reporting implementation
- Automated reporting and alerts
- Managed analytics support
How we work
- Understand
Clarify the management questions, users, reporting calendar, current pack, decisions, and pain points. - Map
Document source systems, KPI inputs, owners, manual steps, refresh timing, and reconciliation issues. - Align
Agree KPI definitions, source authority, hierarchy, access model, and reporting priorities. - Build
Develop integrations, trusted models, Power BI reporting, validation, automation, and security. - Validate & Improve
Reconcile outputs with business owners, support adoption, and evolve the reporting model as priorities change.
FAQ
Can you replace our monthly Excel management pack?
Yes. Datazeb can review the existing pack, underlying sources, calculations, and manual steps, then recommend the most practical way to modernise the process.
Can you connect multiple departments into one executive dashboard?
Yes. Datazeb can integrate finance, sales, operations, inventory, service, and other approved sources into a shared reporting model.
Can you standardise KPIs across the business?
Yes. We can help define shared calculations, ownership, source systems, and reporting logic so the same KPI means the same thing across teams.
Can executives drill into the detail behind a number?
Yes. Power BI can support drill-down and drill-through from high-level KPIs into the underlying business dimensions and transactions where appropriate.
Can reporting be automated?
Yes. Ingestion, transformation, validation, refresh, distribution, and selected alerts can be automated depending on the environment.
Can you support the reporting after launch?
Yes. Managed analytics support can cover new KPIs, source changes, troubleshooting, performance, integrations, and ongoing enhancements.