
OPERATIONS ANALYTICS

See where work is flowing, where it is slowing, and what needs attention

Datazeb helps organisations connect operational data across systems, teams, locations, workflows, and service processes into reliable analytics and reporting.

We build the integrations, KPI logic, Power BI dashboards, alerts, and automation needed to improve visibility across workload, throughput, service levels, capacity, quality, and operational exceptions.

Common operations reporting problems

  • Teams maintain separate spreadsheets for the same process
  • Workload and capacity are difficult to compare
  • Backlogs are visible but the reasons behind them are not
  • Service-level reporting is inconsistent
  • Operational KPIs are calculated differently by different teams
  • Exceptions are discovered too late
  • Management reports show totals but not process bottlenecks
  • Daily or weekly reporting requires manual consolidation

What Datazeb can deliver

Operational Performance Dashboards

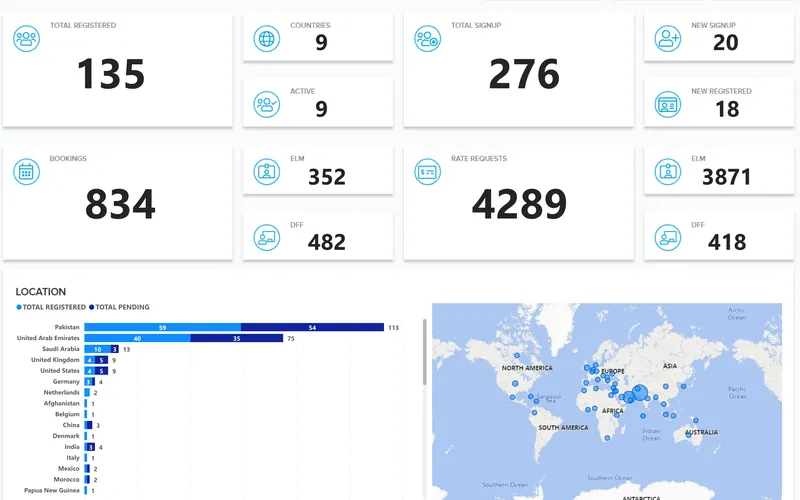
Track throughput, workload, backlog, capacity, service levels, productivity, exceptions, and trends.

Process & Workflow Analytics

Measure how work moves through stages, queues, statuses, hand-offs, and completion points.

Capacity & Utilisation Analytics

Compare demand, workload, resources, available capacity, and utilisation using agreed definitions.

Service-Level Reporting

Monitor turnaround times, response times, SLA performance, delays, breaches, and service exceptions.

Exception & Alerting

Identify late, stalled, failed, high-risk, or unusual operational conditions and notify the right people.

Automated Operations Reporting

Reduce recurring manual reporting, data preparation, status summaries, and management packs.

From operational systems to one management view

  1. Operational Systems
  2. Integrate
  3. Process & KPI Logic
  4. Power BI / Alerts
  5. Operational Action

The most important work is usually in the middle: aligning statuses, timestamps, locations, teams, process stages, business rules, and exception definitions before the dashboard is treated as reliable.

Throughput and workload analytics

  • Volume received
  • Volume completed
  • Work in progress
  • Backlog
  • Throughput by team / location
  • Daily / weekly / monthly trend
  • Workload mix
  • Completed vs pending

This helps managers see whether operational demand is increasing faster than the process can absorb it.

Process and workflow analytics

Understand how work moves through the operation

  • Stage-to-stage movement
  • Queue volume
  • Time in status
  • Handoffs between teams
  • Stalled items
  • Rework
  • Completion rates
  • Process exceptions

The objective is to identify where time is being lost, where work is accumulating, and where rules or hand-offs may need attention.

Capacity and utilisation

Compare demand with the capacity available to handle it

  • Available capacity
  • Workload per team / resource
  • Utilisation
  • Productive vs non-productive time where relevant
  • Peak-period demand
  • Backlog vs capacity
  • Location / team comparison

Service levels and turnaround time

  • Response time
  • Completion time
  • Turnaround time
  • SLA attainment
  • SLA breaches
  • Ageing of open work
  • Priority / severity performance
  • Customer or service-unit comparison

Definitions should be agreed with the operational owner so the same service-level measure is calculated consistently.

Backlog and exception analytics

Make the problem visible before it becomes a monthly surprise

  • Backlog size and ageing
  • Late items
  • Stalled work
  • Missing information
  • Failed process steps
  • Unassigned work
  • High-priority exceptions
  • Repeated exception reasons

Exception reporting can be paired with alerts so teams act on the issue rather than repeatedly searching for it.

Multi-site and multi-team operations

  • Common KPI definitions
  • Location / branch comparison
  • Team-level drill-down
  • Regional performance
  • Central management view
  • Role-based local access
  • Standardised status and exception logic

Explore Multi-Site & Multi-Entity Analytics

Quality and operational control

  • Error / defect rates
  • Rework
  • Failed checks
  • Incomplete cases / orders / transactions
  • Exception reasons
  • Quality by team / location
  • Trend analysis

Quality should be viewed alongside throughput so the organisation does not improve speed by simply creating more rework.

Operations and finance alignment

Connect activity with cost and commercial impact

Where finance data is available, Datazeb can help relate operational performance to:

  • Cost per activity or service where appropriate
  • Revenue or margin impact
  • Overtime / resource cost
  • Backlog-related cost
  • Location / department performance
  • Budget vs actual

Financial definitions should be validated with finance before they are used as operational KPIs.

Operational reporting automation

  • Daily operational summaries
  • Scheduled data refresh
  • Backlog alerts
  • SLA breach notifications
  • Failed-load alerts
  • Exception routing
  • Recurring management packs
  • Cross-system status workflows

Explore Business Process Automation

AI opportunities for operations

  • Natural-language questions over approved operational data
  • Exception summaries
  • Internal SOP / process knowledge assistants
  • Case / ticket / document classification
  • AI-assisted triage with human review
  • Management-summary drafting from approved KPIs

AI should help people interpret and route work, not replace critical operational controls or create unverified decisions.

Data quality and process consistency

  • Missing status values
  • Duplicate records
  • Invalid timestamps
  • Unmapped teams or locations
  • Incomplete process history
  • Late source feeds
  • Inconsistent exception categories
  • Different KPI logic between teams

Operational analytics is often the fastest way to expose where process data itself needs improvement.

Why Datazeb for operations analytics

  • Business-first reporting around flow, service, capacity, workload, and exceptions
  • Power BI and data engineering in one delivery model
  • Strong API, SQL, Python, database, and operational-system integration capability
  • Focus on process definitions and reconciliation before visualisation
  • Ability to combine analytics, alerts, automation, and ongoing support
  • Flexible project and retainer models
  • Senior-led global delivery

Engagement options

  • Operations reporting assessment
  • Operational performance dashboard
  • Workflow / process analytics
  • Capacity and utilisation reporting
  • SLA / turnaround analytics
  • Multi-site operations reporting
  • Automated exception reporting
  • Managed analytics support

How we work

  1. Understand
    Clarify the process, service model, workload, teams, users, decisions, exceptions, and current reporting pain points.
  2. Map
    Document systems, stages, statuses, identifiers, timestamps, teams, locations, and operational rules.
  3. Align
    Agree KPI definitions for throughput, backlog, service levels, capacity, utilisation, quality, and exceptions.
  4. Build
    Develop integrations, trusted operational models, Power BI reporting, validation, alerts, and automation.
  5. Validate & Improve
    Reconcile outputs with operational stakeholders, support adoption, and evolve the model as processes change.

FAQ

Can you combine data from multiple operational systems?

Yes. Datazeb can integrate approved data from APIs, databases, files, workflow systems, ERP, CRM, ticketing platforms, and other sources.

Can you report backlog and turnaround time?

Yes. Where reliable status and timestamp history exists, Datazeb can build backlog, ageing, cycle-time, and turnaround reporting.

Can you compare multiple locations or teams?

Yes. Shared KPI definitions and mapping can support consistent comparisons with local drill-down.

Can you create alerts for operational exceptions?

Yes. Defined conditions can be used for notifications or workflow actions where appropriate.

Can you measure utilisation and capacity?

Yes. The definitions should first be agreed for the specific operating model so the metrics remain meaningful.

Do you provide ongoing support?

Yes. Managed analytics support can cover new reports, source changes, integrations, troubleshooting, and continuous improvement.

Make operational problems visible before they become management surprises

If teams still depend on manual status reports, disconnected systems, or late operational packs, tell us how the process works today. Datazeb can help create a more reliable view of workload, throughput, service levels, capacity, quality, and exceptions.