RETAIL ANALYTICS

Connect sales, products, customers, stores and stock into one clearer view

Datazeb helps retailers combine POS, ecommerce, inventory, customer, supplier, and finance data into trusted analytics and reporting.

We build the integrations, data models, Power BI dashboards, validation logic, and automation needed to improve visibility across sales, product performance, stores, customers, inventory, margin, and operational exceptions.

Common retail analytics problems

  • POS sales do not reconcile cleanly with finance
  • Product codes differ between stores, channels, or systems
  • Online and physical-store reporting is separated
  • Inventory and sales are reviewed in different reports
  • Margin is unclear by product, category, store, or channel
  • Customer data is fragmented across loyalty, ecommerce, and CRM platforms
  • Store managers use different reporting methods
  • Management packs depend on manual exports and spreadsheets

What Datazeb can deliver

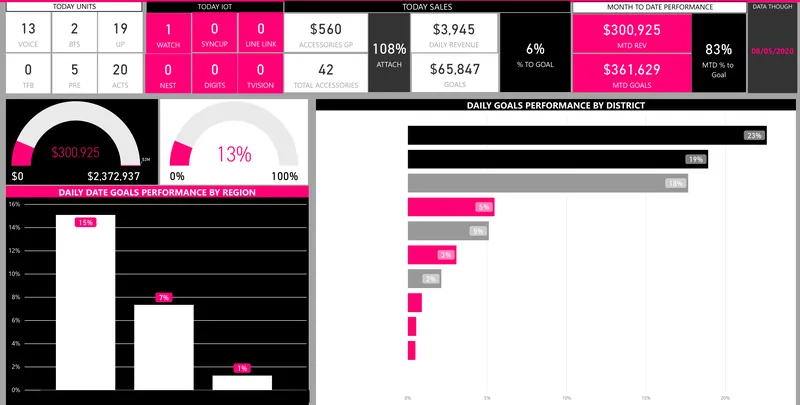
Retail Performance Dashboards

Track revenue, units, transactions, customers, products, stores, channels, targets, and trends.

Product & Category Analytics

Analyse product, SKU, category, brand, sales velocity, margin, returns, and stock context.

Store & Location Analytics

Compare stores, branches, regions, or formats using shared KPIs and consistent business logic.

Customer Analytics

Understand new vs returning customers, purchase patterns, segments, repeat activity, and customer value where data allows.

Channel & Omnichannel Reporting

Bring POS, ecommerce, marketplaces, wholesale, and other sales channels into a common reporting model.

Margin & Commercial Analytics

Connect sales with cost and finance data to understand gross margin and commercial mix where reliable cost data exists.

Retail Data Integration

Connect POS, ecommerce, ERP, inventory, CRM, finance, supplier, API, database, and file-based data sources.

Automated Retail Reporting

Reduce manual exports, spreadsheet consolidation, daily reporting, and repetitive management packs.

From retail systems to one trusted reporting model

  1. POS / Ecommerce
  2. Inventory / CRM
  3. Reconcile & Map
  4. Trusted Retail Model
  5. Power BI / Action

The most important work is usually the mapping and reconciliation layer: products, stores, customers, channels, returns, discounts, dates, costs, and inventory must line up before the dashboard can be trusted.

Sales performance analytics

  • Revenue and units
  • Transactions
  • Average transaction value
  • Period growth
  • Target vs actual
  • Store / region performance
  • Channel performance
  • Category / product mix
  • Daily, weekly, monthly, and seasonal trends

Sales reporting should use one agreed commercial definition across POS, ecommerce, and finance wherever possible.

Product and category analytics

See what is driving growth – and what is slowing down

  • Revenue by product / SKU
  • Units sold
  • Sales velocity
  • Category / brand performance
  • Margin where cost data is available
  • Returns
  • Stock context
  • High-revenue / low-margin products
  • Slow-moving products

Product analytics becomes significantly more useful when sales, stock, cost, and product master data are aligned.

Store and location analytics

  • Sales by store
  • Margin by store
  • Transaction activity
  • Product mix
  • Target attainment
  • Inventory availability
  • Stockouts
  • Period trends
  • Region / location comparison

A common KPI model allows fair comparison while still preserving local drill-down.

Explore Multi-Site & Multi-Entity Analytics

Customer analytics

Understand the relationship beyond a single transaction

  • New vs returning customers
  • Purchase frequency
  • Repeat purchase
  • Customer segments
  • Average customer value
  • Product affinity
  • Geographic patterns
  • Cohort behaviour where data supports it

Omnichannel and channel analytics

  • Physical stores
  • Ecommerce
  • Marketplaces
  • Wholesale
  • B2B
  • Social commerce
  • Regional storefronts

Datazeb can standardise product, customer, store, and channel reporting while preserving channel-specific detail.

Margin and commercial performance

Revenue does not tell the whole story

  • Gross margin
  • Margin percentage
  • Margin by product / category
  • Margin by store / region
  • Margin by channel
  • Discount impact
  • Return / refund impact
  • High-volume / low-margin items

Cost and margin definitions should be validated with finance before they are used as management KPIs.

Retail inventory context

Sales performance improves when stock context is visible

  • Stock on hand
  • Availability
  • Stockouts
  • Days of stock / cover
  • Slow-moving inventory
  • Ageing
  • Product availability by channel
  • Sales velocity vs stock

Customer, product and store mapping

Retail reporting is only as strong as the master data beneath it

  • SKU / barcode mapping
  • Category hierarchies
  • Brand mappings
  • Store / location codes
  • Customer identifiers
  • Channel definitions
  • Supplier product codes

Datazeb can build reference logic and validation so the same product, customer, or store is not reported differently across systems.

Retail reporting automation

  • Daily sales summaries
  • Store-performance reporting
  • Automated Power BI refresh
  • Low-stock / stockout alerts
  • Failed-load notifications
  • Management-pack automation
  • Product or store exception alerts

Explore Business Process Automation

AI opportunities

  • Natural-language questions over approved retail data
  • AI-assisted sales or inventory exception summaries
  • Customer-support assistants using approved product and policy information
  • Internal product / operations knowledge assistants
  • Customer-feedback summarisation
  • Product-content enrichment with human review

AI should be grounded in trusted retail data and approved information, not used to compensate for poor product or customer data.

Data quality and reconciliation

  • Duplicate products
  • Unmapped SKUs
  • Store / location mismatches
  • Sales that do not reconcile to finance
  • Returns recorded inconsistently
  • Missing customer or channel mappings
  • Late source feeds
  • Inventory balances that differ between systems

Automated validation can surface these issues before they distort management reporting.

Existing retail reporting review

Improve what exists before deciding to rebuild

Datazeb can review:

  • Existing Power BI dashboards
  • POS reporting
  • Ecommerce reporting
  • Excel management packs
  • Product / store mapping files
  • Inventory reports
  • Current KPIs
  • Known reconciliation issues

The outcome may be optimisation, integration, data-quality improvement, or a phased reporting rebuild.

Why Datazeb for retail analytics

  • Power BI and data engineering in one delivery model
  • Strong POS, ecommerce, API, database, SQL, Python, and finance-integration capability
  • Focus on product, store, customer, and channel reconciliation before visualisation
  • Ability to connect sales, inventory, margin, customer, and operational data
  • Automation, AI, and managed support where appropriate
  • Flexible project and retainer models
  • Senior-led global delivery

Engagement options

  • Retail reporting assessment
  • Sales performance dashboard
  • Store / region reporting
  • Product and category analytics
  • Customer analytics
  • Omnichannel reporting
  • Retail data integration
  • Managed analytics support

How we work

  1. Understand
    Clarify the retail model, channels, stores, products, customers, users, reporting pain points, and management questions.
  2. Map
    Document POS, ecommerce, inventory, CRM, finance, products, stores, channels, and identifiers.
  3. Reconcile
    Align product, store, customer, sales, returns, cost, inventory, and channel logic.
  4. Build
    Develop integrations, trusted retail models, Power BI reporting, validation, alerts, and automation.
  5. Validate & Improve
    Reconcile outputs with commercial and finance stakeholders, support adoption, and refine the model as operations change.

FAQ

Can you combine POS and ecommerce reporting?

Yes. Datazeb can bring multiple sales channels into a common model where products, stores, customers, and transactions can be mapped reliably.

Can you report sales and inventory together?

Yes. Sales velocity, stock, availability, ageing, stockouts, and product performance can be combined where the required data exists.

Can you report margin by product or store?

Yes, where reliable revenue and cost data is available and the finance definitions are agreed.

Can you compare multiple stores or regions?

Yes. Shared KPI definitions and hierarchy mappings can support consolidated reporting with local drill-down.

Can you build customer analytics?

Yes. Customer, repeat-purchase, segment, cohort, and product-affinity analysis can be supported where appropriate customer data is available.

Do you provide ongoing support?

Yes. Managed analytics support can cover new reports, source changes, data-quality issues, integrations, and continuous improvement.

Connect the data behind sales, customers, products, stores and stock

If retail performance is still spread across POS reports, ecommerce dashboards, inventory systems, finance exports, and spreadsheets, tell us how reporting works today. Datazeb can help create one more reliable view of commercial performance – from the underlying data to the management decision.