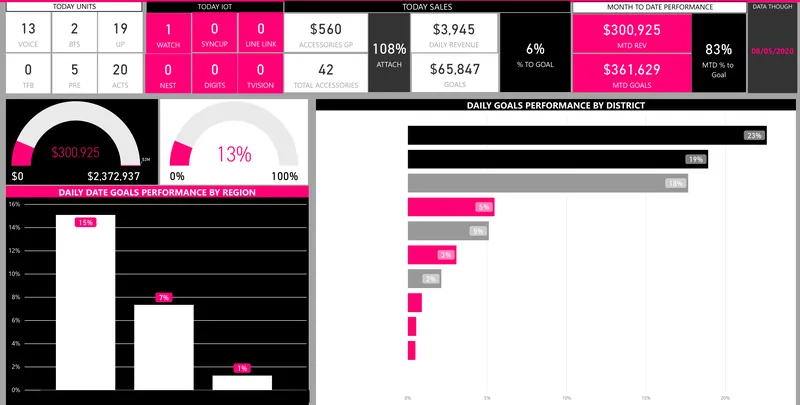
Client names are withheld. Specific commercial metrics are not published for confidentiality.
From local systems to one reporting model
The core design challenge is to standardise enough for meaningful comparison while preserving the attributes and detail that matter locally.
01Local Systems
02Standardise & Map
03Trusted Group Model
04Executive View
05Controlled Local View
In detail
Explore the detail
Entity and hierarchy design
The reporting structure should reflect how the organisation actually operates
Datazeb can help model relationships such as: A clean hierarchy allows management reporting to aggregate correctly without flattening the organisation into one undifferentiated total.
Group → company → department
Region → branch → team
Brand → store → department
Healthcare network → clinic → service
Franchise group → franchisee → location
Business unit → project → cost centre
Standard KPI definitions
Comparison is meaningless if every entity calculates the metric differently
Datazeb can help define common reporting logic for: Where local definitions genuinely need to differ, the model should make the difference explicit rather than hiding it.
Revenue and margin
Operational activity
Utilisation
Inventory
Service levels
Customer or patient activity
Budget vs actual
Productivity
Quality or exception measures
Consolidated executive reporting
Give leadership a single view without waiting for manual rollups
Outcome: management sees the same numbers at the same time instead of reviewing separately prepared local packs.
Group performance
Entity / location ranking
Period trends
Variance analysis
Budget vs actual
Regional comparison
Exception indicators
Drill-down into supporting detail
Local and regional reporting
Central standardisation should not make local reporting less useful
Datazeb can create views tailored to: The same trusted model can support different views while keeping KPI logic consistent.
Branch managers
Store managers
Clinic managers
Regional leaders
Department heads
Entity finance teams
Operational teams
Role-based access
Show the right detail to the right users
Depending on the environment, access can be designed around: Power BI row-level security and upstream data controls can be combined where appropriate.
Company
Region
Location
Department
Business unit
Manager / ownership relationship
Multi-company and financial consolidation
Bring entity performance together without pretending accounting is simple
Where finance data is available, Datazeb can support analytical consolidation across: Formal statutory consolidation, eliminations, tax, and accounting treatment should remain under the client's finance and accounting governance.
Revenue
Cost
Margin
Budget and actuals
Cost centres
Departments
Entities
Currencies where required
Currency and calendar differences
Distributed organisations may report across different currencies, fiscal calendars, or trading periods.
A reporting model may need to account for: These rules should be explicitly documented so group comparisons remain explainable.
Reporting currency vs local currency
Approved exchange-rate source
Historical vs current conversion rules
Fiscal periods
4-4-5 or other operational calendars
Regional time zones
Different source systems across entities
Standard reporting does not require every entity to use the same software
Datazeb can integrate heterogeneous environments where different entities use different systems. The reporting layer can standardise the output even when the source architecture remains mixed.
Different ERP or accounting systems
Different POS systems
Different CRM platforms
Local databases
APIs
Scheduled files
Spreadsheets during transition
FAQ
Frequently asked questions
Can you combine data from different systems used by different entities?
Yes. A common reporting model can standardise outputs from different databases, APIs, files, ERP systems, and local tools where reliable access is available.
Can head office see everything while local managers only see their location?
Yes. Role-based access and Power BI row-level security can support different views for central and local users.
Can you handle different KPI definitions across entities?
Yes. The first step is to identify which definitions should be standardised and where legitimate local differences need to remain visible.
Can you support multiple currencies?
Yes, for management analytics where the approved exchange-rate source and conversion rules are defined by the client.
Do all entities need to move onto the same source system?
No. Standardised analytics can often be built across mixed source systems without requiring immediate platform replacement.
Learn it yourself · Datazeb Training
Learn Power BI with Datazeb Training
Prefer to build the skills in-house? Live online Power BI courses taught by the same practitioners who deliver these projects.
Standardise the reporting without losing the detail that makes each operation different
If your monthly reporting depends on combining separate location, company, branch, or department reports, tell us how the structure works today. Datazeb can help create one trusted model for group visibility, local reporting, controlled access, and future growth.