
Case study · Retail
Store operations and compliance reporting for a 50+ location retailer
A multi-location retailer was running its stores on separate Excel reports. Datazeb built a Power BI reporting suite that measures every store, district and region against the same operating targets.
- Client
- Mobile and electronics retailer (anonymised)
- Region
- United States
- Scale
- 50+ stores in 10 states
- Work
- Power BI reporting suite
The challenge
What was difficult
The business had grown to more than 50 locations across 10 states, but it had no shared view of how those stores were performing.
Store managers relied on basic Excel reports for sales data. Each store tracked its numbers in its own way, so district and regional managers could not compare locations, and operational problems surfaced late.
Data involved
- ERP and end-of-day sales data from NetSuite
- Point-of-sale transactions and store traffic
- Inventory receiving, returns and stock movements
- Store audit results and compliance checks
- Sales targets, budgets and incentive plans
- IT support tickets
Architecture
How the solution fits together
Sources
- ERP and end-of-day sales data from NetSuite
- Point-of-sale transactions and store traffic
- Inventory receiving, returns and stock movements
- Store audit results and compliance checks
- Sales targets, budgets and incentive plans
- IT support tickets
Data model
- Data model & targets
- DAX
- Power Query
Reporting
- Power BI report suite
Who uses it
- Store → district → region
Decisions
- Daily operating decisions
What we built
The delivered solution
One data model feeds a suite of reports. They all share the same filters for month, region, district and store, and every page shows the date its data runs to.
-
Operations compliance scorecard
Thirteen store-level operating measures, from device condition and inventory variance to returns, stock rebalancing and NetSuite scan counts, each shown against its target. Financial loss from missed controls is broken down by district.
-
End-of-day sales
Daily units, revenue, accessories and gross profit from NetSuite against budget, with month-to-date progress by region and district.
-
Traffic, conversion and attach rate
Revenue per store visit, conversion against goal and accessory attach rate, so a busy store and a well-run store are no longer treated as the same thing.
-
Receiving and returns compliance
Monthly and weekly compliance trends, pending and overdue shipments, same-day receiving by weekday, and stores that fall behind.
-
Store audits
Standard and operational-readiness audit scores by store and period, with each audit area's result against its passing score.
-
Incentives, credits and support
Year-to-date incentive rankings, credit budget tracking, deactivations and IT ticket resolution in the same environment.
-
Report adoption
A viewership report shows which reports each department and role actually opens, so the suite can be improved based on real use.
From the project
Screens from the delivered reports
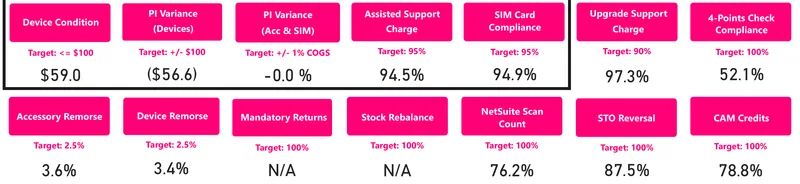
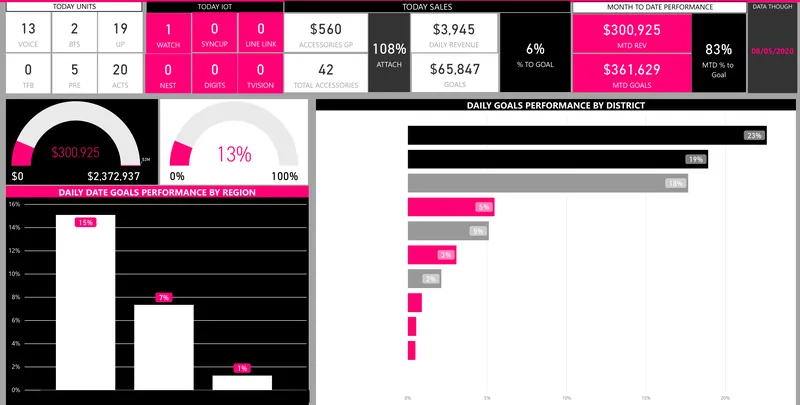

Clients are anonymised. Screenshots come from the delivered reports, with client names, logos, people and locations removed. Figures shown are the reports' own data, not results claimed by Datazeb.
Outcome
What changed
- Store, district and regional performance is reported from one model instead of separate store spreadsheets.
- Every location is measured against the same targets and definitions.
- The cost of missed operational controls is visible by district, not discovered at month end.
- Sales, inventory, audit, incentive and support reporting sit in one place.
- Report usage is measured, so the business can see which reports people rely on.
Specific commercial metrics are withheld for confidentiality.
Technology
Tools and related work
- Power BI
- NetSuite
- POS data
- Excel (replaced)
- DAX
- Power Query
Related
Facing a similar problem?
Tell us what is difficult today. We can help determine whether a similar approach could work in your environment.