
Case study · Healthcare & public sector
National diabetes and e-services analytics for a public health authority
A national health authority needed one view of its diabetes population, clinical care and new digital services. Datazeb built a programme of Power BI dashboards on the authority's own on-premises reporting server.
- Client
- National public health authority (anonymised)
- Region
- Middle East
- Scale
- National: health regions, hospitals and clinics
- Work
- Power BI dashboards and Report Server
The challenge
What was difficult
Health information sat in separate places: the national disease registries, the records of each clinic and hospital, and new digital services such as electronic sick leave.
Leaders needed national, regional and clinic-level answers from that data: how many people live with diabetes, how well their condition is controlled, which facilities carry the load, and whether digital services are changing demand on clinics. Because this was patient data, the reporting had to run inside the authority's own environment.
Data involved
- National diabetes and disease registries (multi-year history)
- Primary care clinic and hospital activity
- Electronic sick-leave apps and in-person leave records
- Medical report requests by hospital
- School health registration and student vaccination data
- Power BI Report Server, on premises
Architecture
How the solution fits together
Sources
- National diabetes and disease registries (multi-year history)
- Primary care clinic and hospital activity
- Electronic sick-leave apps and in-person leave records
- Medical report requests by hospital
- School health registration and student vaccination data
Data model
- Cleaned clinical model
- SQL
- DAX
- Power Query
Reporting
- Power BI Report Server (on-prem)
- Power BI Report Server, on premises
Who uses it
- National → region → clinic
Decisions
- Policy & service planning
What we built
The delivered solution
The dashboards share one way of filtering by year, age group, gender, nationality and health region. They are published on the authority's own reporting server.
-
National diabetes overview
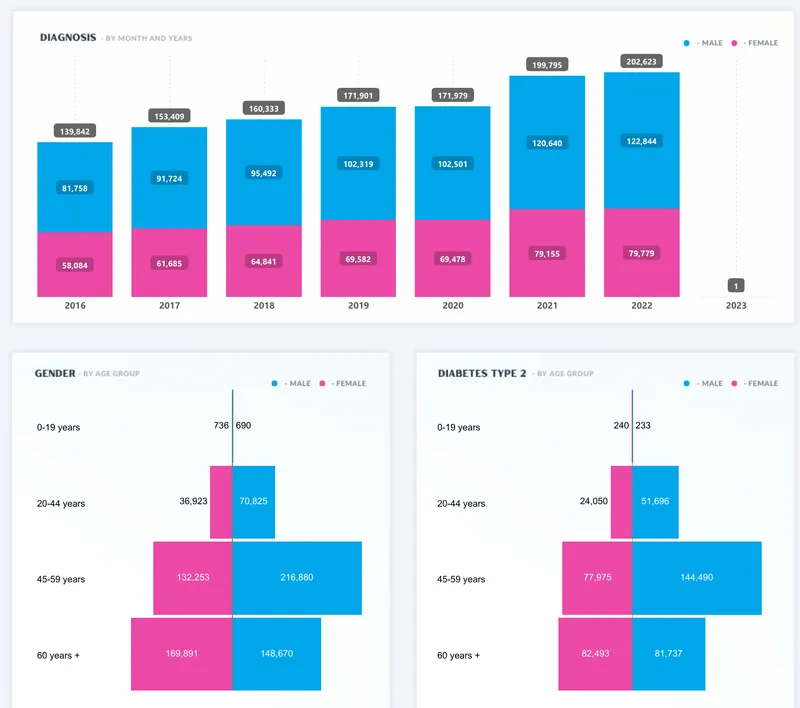
Registered patients by diabetes type, age, gender and area, with diagnosis trends over several years.
-
Clinical control
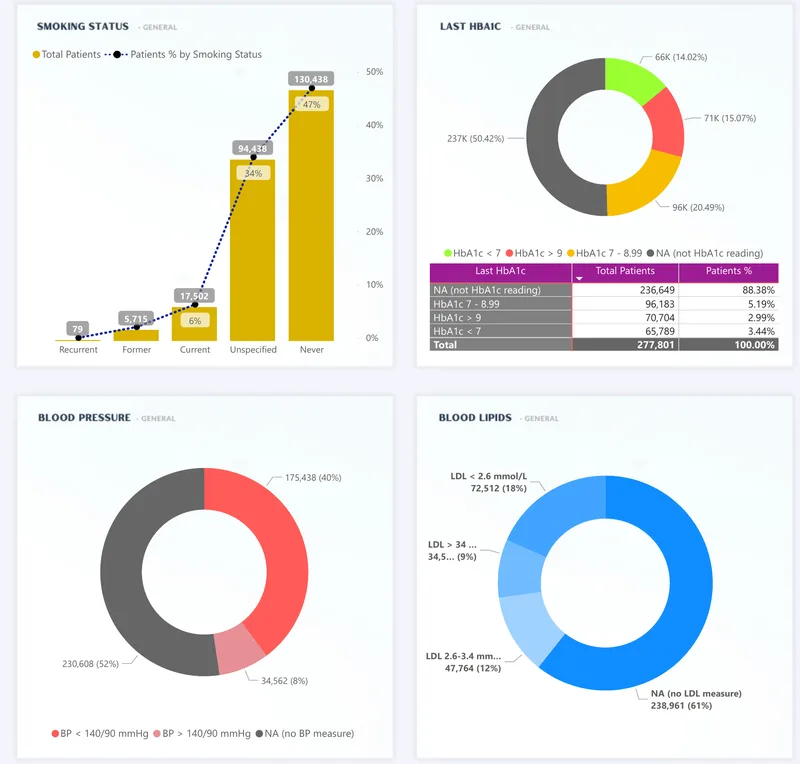
Risk-factor and metabolic control: BMI groups, HbA1c bands, blood pressure, blood lipids and smoking status, including how many patients have no recent reading.
-
Facility utilisation
Patients and visits by clinic and hospital, so service load can be compared across facilities and health regions.
-
E-services performance
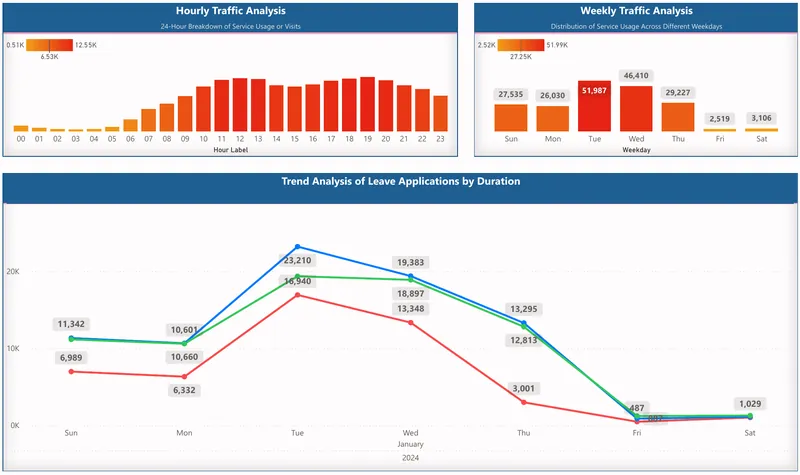
Electronic and in-person sick-leave requests compared by source app, duration, hour of day and weekday, plus analysis of how digital services affected clinic visits.
-
Registry and programme dashboards
National disease registry, medical report requests, school health registration and student vaccination coverage.
-
On-premises platform and documentation
Power BI Report Server administration and full documentation, so the authority's own team can run and maintain the platform.
From the project
Screens from the delivered reports
Clients are anonymised. Screenshots come from the delivered reports, with client names, logos, people and locations removed. Figures shown are the reports' own data, not results claimed by Datazeb.
Outcome
What changed
- National, regional and clinic-level diabetes figures come from one consistent model.
- Gaps in clinical data, such as patients with no recent HbA1c or blood pressure reading, are visible and can be followed up.
- The effect of digital services on clinic demand can be measured rather than assumed.
- Sensitive health data stays inside the authority's own on-premises environment.
- Documentation lets the internal team operate the reporting platform after handover.
Specific commercial metrics are withheld for confidentiality.
Technology
Tools and related work
- Power BI
- Power BI Report Server
- SQL
- DAX
- Power Query
Related
Facing a similar problem?
Tell us what is difficult today. We can help determine whether a similar approach could work in your environment.